Overview
XYmath will find the “best” curve fit using either minimum percent error or minimum total error. It can search through common equations, an exhaustive search through thousands of equations, splines, smoothed splines, or fit non-linear equations input by the user.
After fitting, XYmath will find roots, minima, maxima, derivatives or integrals of the curve.
It will generate source code that documents and evaluates the fit in python, FORTRAN or EXCEL.
Configurable plots are created using matplotlib that are of publication quality.
Note
In order to meet the user’s request for minimum total or percent error on calculated y value,
sometimes matrix methods are used to obtain a first estimate of equation constants and then followed
up with calls to scipy.optimize.leastsq to finalize the equation constants.
Basic Usage
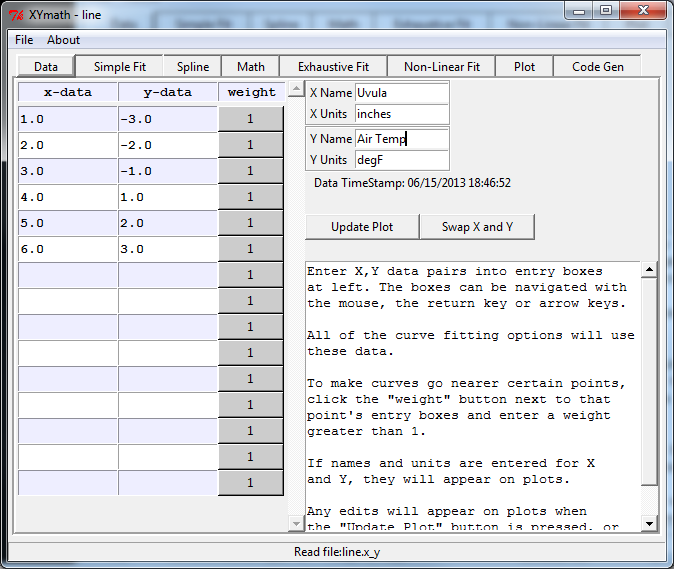
The interface consists of tabbed pages for each of the major functions. The data entry page below shows all of the tabs.
Data - for entering X,Y data and data definitions
Simple Fit - fits the data to common equations and ranks them
Spline - fits the data to one of several splines
Math - performs min/max, derivative, integration, root finding on curve fit
Exhaustive Fit - searches hundreds or millions of equations for best fit
Non-Linear Fit - fits data to a user-defined, non-linear equation
Plot - provides plotting options
Code Gen - generates python, FORTRAN or Excel code to document and implement curve fit
There is a “Show Help” button on most pages to provide guidance.